

Best Mobiles for Trading in India 2024
📱 Looking for the best mobile for trading in India? Learn which mobiles offer fast processing, sharp display, strong security & smooth connectivity for traders.
Edited By
George Palmer
Bollinger Bands are a popular technical analysis tool used to gauge market volatility and identify potential price reversals. For traders in India and beyond, understanding the right settings for Bollinger Bands can make the difference between timely trades and missed opportunities.
At its core, a Bollinger Band is formed by three lines: the middle band, typically a simple moving average (SMA); and two outer bands that represent standard deviations away from the middle band. The most common settings use a 20-period SMA with bands set at two standard deviations, but this default is not set in stone.
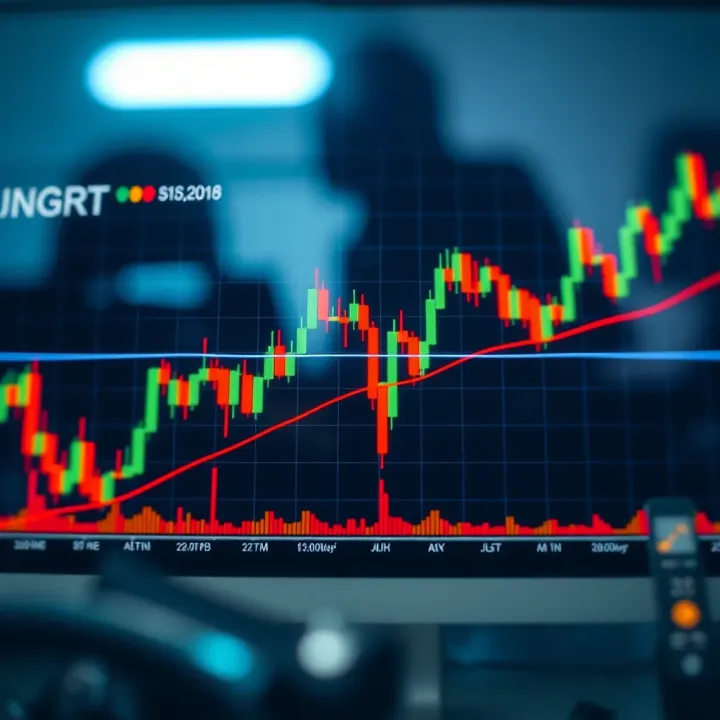
Adjusting these parameters helps tailor the bands to fit different trading styles and market environments. For example, short-term traders focusing on fast intraday moves might reduce the SMA period to 10 or 15, tightening the bands and capturing quicker signals. Conversely, long-term investors may prefer a 30-period SMA to smooth out noise and focus on broader trends.
Choosing the right Bollinger Band settings depends heavily on the asset's volatility and the trader's time horizon.
In more volatile markets like cryptocurrency or small-cap stocks, increasing the standard deviation to 2.5 or 3 can prevent false breakouts, while in stable, large-cap shares on the NSE or BSE, a 2-standard deviation band usually suffices.
Here’s what traders typically consider when tweaking Bollinger Bands:
Period length: Shorter periods react quickly but can trigger false signals; longer periods provide smoother trends but lag more.
Standard deviation: Higher values widen bands, filtering noise; lower values tighten them, signalling more frequent trading opportunities.
Market condition: Trending markets benefit from wider bands to avoid premature entries; sideways markets suit narrower bands to spot range plays.
Practical usage also involves combining Bollinger Bands with indicators like the Relative Strength Index (RSI) or Moving Average Convergence Divergence (MACD) for better confirmation. For example, a price touching the lower band while RSI shows oversold suggests a buying chance rather than relying on the band signal alone.
Getting these settings right can help traders spot entry and exit points with better precision, reduce whipsaws, and improve overall strategy confidence. The rest of this article explains how to select and fine-tune these parameters effectively for Indian markets and global trading alike.
Bollinger Bands provide traders with a practical way to measure market volatility and identify potential entry or exit points. Knowing how these bands work can prevent costly mistakes and improve decision-making, especially in volatile Indian equity or commodity markets.
Bollinger Bands consist of three lines: a middle moving average and two outer bands set above and below it. The middle line often uses a simple moving average (SMA), reflecting the average price over a certain number of periods. The upper and lower bands show the standard deviation levels away from this average, creating a dynamic range.
These components together help traders visualise price action and spot unusual market behaviour. For example, when prices hit the upper band, it might signal the asset is overbought; touching the lower band could indicate it’s oversold.
In technical analysis, Bollinger Bands serve as a tool to assess price trends and volatility. They assist in timing trades based on the expansion or contraction of the bands, signalling moments when price volatility increases or decreases sharply.
For instance, during a sideways market, bands tend to narrow (a 'squeeze'), alerting traders to prepare for a possible breakout. In contrast, wide bands suggest large price swings and heightened volatility.
Bollinger Bands adjust dynamically to price changes. When the market becomes more volatile, the bands widen to accommodate bigger price movements. Conversely, in calm markets, the bands contract.
This responsiveness is valuable in markets like Indian commodities, where sudden price shocks are common due to weather or policy shifts. Traders benefit from watching how bands expand or shrink to decide when to enter or exit trades.
A sharp widening of bands often precedes strong price moves, while tight bands hint at consolidation phases, guiding traders to adapt their strategies accordingly.
The choice of moving average period influences how quickly the bands react to price changes. A shorter period (like 10 days) makes bands more sensitive, suited for quick intraday trades, while longer periods (20 or 50 days) smooth out noise for swing or position traders.
For example, many Indian traders use a 20-period moving average to balance responsiveness and stability, aligning well with monthly or weekly cycles.
The multiplier determines how far the bands sit from the moving average. Setting it at 2 standard deviations is common, capturing around 95% of price action within the bands. Lowering this multiplier tightens the bands, leading to more frequent signals but also more false alarms.
Adjusting this setting helps traders manage risk by controlling how sensitive the bands are to price swings.
The default combination—20-period moving average and 2 standard deviations—works well for most markets and timeframes. This setup strikes the right balance between catching meaningful trends and avoiding excessive noise.
Still, traders should consider tweaking these values to suit their specific instruments and trading styles. For instance, active day traders may prefer narrower bands to catch quicker moves, whereas long-term investors might use wider bands to focus on major trends.
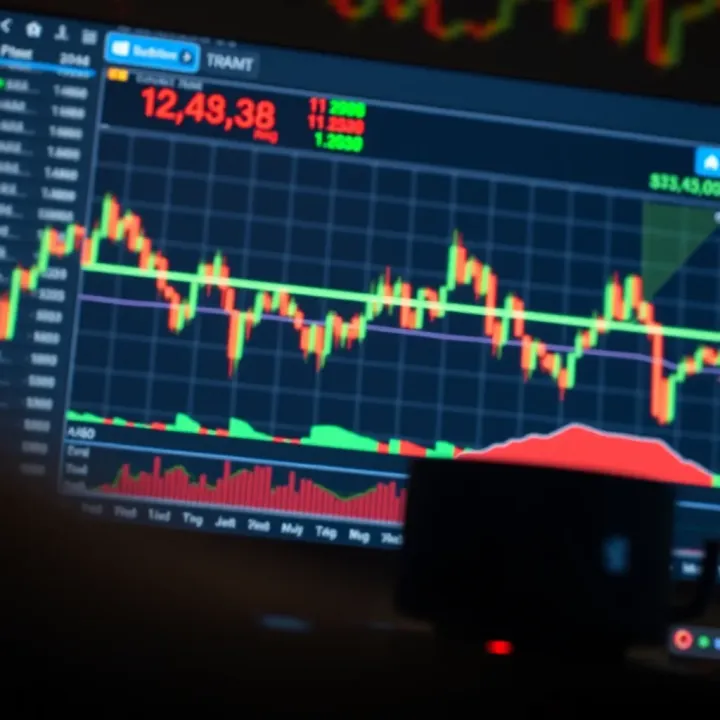
Getting familiar with these fundamentals makes it easier to customise Bollinger Bands effectively, helping you level up your trading strategy with more confidence and control.
The 20-period moving average is the backbone of Bollinger Bands, serving as the central line around which the bands form. This moving average smooths out price data over the past 20 periods, providing a snapshot of the market’s recent trend. For example, in daily charts of the Nifty 50 index, the 20-day EMA gives a reasonable balance between responsiveness to recent price changes and avoiding too much noise from minor fluctuations.
This period length reflects roughly one trading month, which gives traders and investors a practical timeframe for decision-making. Shorter periods may react too quickly, producing false signals, while longer ones might lag behind important market turns. Hence, the 20-period moving average tends to work well in Indian equity markets by capturing significant price movements without being jittery.
The bands themselves are set at 2 standard deviations above and below this 20-period moving average. Standard deviation measures the dispersion or volatility of prices around the average. Setting bands at 2 standard deviations means roughly 95% of price action should remain within these bands under normal market conditions.
This spacing adjusts dynamically with market volatility—bands widen when the market is choppy and contract during calmer phases. Traders use this to identify potential breakouts or reversals. For instance, if Reliance Industries’ stock price moves outside the upper band on heavy volume, it might signal strong bullish momentum, whereas a dip below the lower band could hint at oversold conditions.
The default combination of a 20-period moving average and 2 standard deviation bands maintains a good balance between sensitivity and noise. This means it’s sensitive enough to alert traders about meaningful price moves but not so twitchy that it reacts to every minor jump or dip. For example, in Indian markets with occasional sharp intraday swings, these settings help filter out false signals while keeping traders alert to real changes.
Moreover, these settings are versatile across multiple timeframes. Whether you’re a day trader watching 15-minute charts on NSE stocks or a swing trader monitoring weekly charts in commodities like gold and crude oil, the 20-period and 2 standard deviation setup remains consistent and reliable. This uniformity simplifies analysis and strategy development without constantly tweaking parameters.
Finally, these settings have proven relevance in Indian equity and commodity markets because of their adaptability. Indian markets often exhibit volatility spikes during events like budget announcements or monsoon outlook updates. The 20-period and 2 SD bands naturally widen in response, helping traders adjust expectations in real time. Applying these settings across assets—from Infosys shares to MCX commodity contracts—gives a dependable foundation for technical analysis in the Indian trading landscape.
Understanding and applying these standard settings effectively can significantly improve your timing for entries and exits, reducing guesswork and helping you trade with more confidence.
Traders must adjust Bollinger Band settings according to the prevailing market conditions to improve accuracy and reduce misleading signals. Market dynamics vary — sometimes prices swing wildly, other times they move within narrow ranges. Using fixed parameters all the time limits the indicator’s usefulness. By tuning the bands to suit volatility, trend strength, or sideways phases, traders can make better-informed decisions.
One effective way to handle volatility is by increasing the standard deviation multiplier, which widens the bands. Wider bands mean the price needs to move more before triggering a signal. This prevents early exits or entries caused by the market’s usual noisy behaviour. For example, during sharp swings in the Nifty index, increasing the bands to 2.5 or 3 standard deviations can filter out erratic spikes that otherwise produce false breakouts.
Wider bands reduce false signals by allowing price to breathe within a larger range before signalling overbought or oversold conditions. This results in fewer but higher quality trade entries. However, traders should be mindful that wider bands can also delay signals, so balancing band width with trading style is crucial. For those using Bollinger Bands on volatile commodities like crude oil or gold in Indian markets, a wider setting often works better to avoid whipsaws.
Shorter moving averages help capture emerging trends more quickly. When markets show clear upward or downward momentum, using a 10 or 15-period moving average sharpens responsiveness. For instance, intraday traders tracking Bank Nifty often prefer quicker-moving averages to detect trend shifts fast. Using shorter periods helps signal entry points earlier but may increase noise.
Conversely, longer periods are better suited for sideways or ranging markets. A 25 to 30-period moving average smoothes price action, reducing the effect of small fluctuations. This setting is common for swing traders holding positions for days or weeks, helping them focus on major levels without reacting to every minor move. Indian equity stocks with low volatility also benefit from longer periods, offering steadier signals.
Combining Bollinger Bands with volume and momentum indicators can enhance signal accuracy. When price touches the bands, confirming with volume spikes indicates greater conviction behind moves. Likewise, indicators like Relative Strength Index (RSI) or Moving Average Convergence Divergence (MACD) help filter false breakouts by showing whether momentum aligns with band signals. For example, a band breakout on Infosys shares accompanied by heavy volume and rising RSI is more reliable than a breakout without such confirmation.
Adapting Bollinger Band settings isn’t about sticking strictly to defaults—it’s about tuning to what the market itself is telling you. Whether markets roar or crawl, adjustments help you spot genuine opportunities and avoid getting caught in noise.
Key points to remember:
Use wider bands during volatile phases to reduce false breakouts
Opt for shorter moving averages in trending markets to catch changes fast
Longer periods work better in sideways markets to smooth signals
Combine bands with volume and momentum tools for better trade validation
With these adjustments, Bollinger Bands become more than just an indicator—they turn into a flexible tool adapting alongside the market’s shifting moods.
Customising Bollinger Bands based on your trading style can significantly enhance your decision-making. Different traders look for different signals — intraday traders need quick, responsive cues, while swing or position traders prioritise filtering noise to spot bigger trends. Adjusting settings like moving average periods and standard deviation helps tailor the bands to fit these unique requirements.
Intraday traders benefit from shorter moving averages because they react faster to price changes. For instance, instead of the typical 20-period moving average, using 10 or even 5 periods makes the Bollinger Bands more sensitive to short-term price moves. This quick responsiveness can alert traders to entry or exit opportunities within minutes or hours, essential in fast-moving markets like NSE or BSE during volatile sessions.
Narrower bands complement this approach by tightening the standard deviation multiplier, sometimes reducing it from 2 to 1.5. This shift means bands hug the price action closely, causing more frequent touches and breakouts, which suits intraday strategies that rely on capturing small, repeated gains. However, traders should watch out for increased false signals due to the higher sensitivity.
Swing and position traders prefer longer periods to reduce market noise and avoid being whipsawed by minor fluctuations. Stretching the moving average to 30 or 50 periods smooths the bands and highlights sustained price trends, which helps traders focus on more reliable signals. This strategy fits well with holding positions over several days or weeks, common in Indian commodity or equity markets.
Broader bands, achieved by increasing the standard deviation multiplier to 2.5 or 3, accommodate larger price swings typical in longer-term trades. Wider bands allow traders to stay inside the bounds through normal volatility, filtering out minor pullbacks and focusing on genuine breakouts. This reduces premature exits and supports strategies aiming for bigger profits over time.
Tailoring Bollinger Band settings to your trading style isn’t just about preference—it influences how accurately you interpret price moves and execute trades. Intraday traders favour speed and sensitivity, while swing and position traders seek stability and clarity.
To sum up, intraday traders might try a 10-period moving average with 1.5 standard deviations, while swing traders could use 30 periods with a 2.5 multiplier. Testing these settings on real market data — like historical Sensex or Nifty movements — helps find what fits your style best and improves your trading outcomes.
Bollinger Bands alone can offer valuable insights about price volatility and potential entry points, but combining them with other technical tools helps improve accuracy. Using complementary indicators filters noise and confirms signals, reducing the chances of false moves. This approach works well across different markets, including Indian equities and commodities, by providing multiple layers of confirmation.
The Relative Strength Index (RSI) and Moving Average Convergence Divergence (MACD) help validate signals from Bollinger Bands, especially around overbought or oversold levels. For example, when price touches the upper Bollinger Band, suggesting potential overbought conditions, an RSI above 70 strengthens this view. Similarly, if MACD shows a bearish crossover near the upper band, it adds weight to a possible reversal.
On the other hand, if the price hits the lower band and RSI falls below 30, indicating oversold conditions, traders can look for bullish signals from MACD to confirm a rebound. This combination prevents acting on band touches alone, which can sometimes be misleading in trending markets.
Breakouts beyond Bollinger Bands often excite traders, but not all lead to sustained moves. Using RSI and MACD helps filter these false breakouts. For instance, a price breakout higher with low RSI momentum or a lack of MACD trend confirmation signals caution. The breakout might be short-lived or lack strength.
Conversely, a breakout supported by rising RSI and a bullish MACD crossover tends to be more reliable. This layered confirmation helps traders avoid jumping into traps caused by sudden spikes or random volatility spikes common in markets like NSE or BSE.
Volume plays a crucial role in verifying the strength of breakout moves outside Bollinger Bands. A breakout accompanied by a noticeable increase in trading volume typically signals genuine interest and commitment from market participants.
For example, if Reliance Industries’ share price breaks above the upper Bollinger Band with a volume spike, it suggests strong bullish pressure. Without a volume surge, the breakout may lack follow-through and quickly revert.
Overlaying trendlines and horizontal support or resistance with Bollinger Bands improves signal accuracy. Bands tend to widen around strong trends, but reversals often coincide with key support or resistance levels. Observing price behaviour near these zones helps confirm or reject trade setups signalled by Bollinger Bands.
Suppose Tata Motors’ stock approaches its 20-period moving average which also aligns with a major support level while price touches the lower Bollinger Band. This convergence implies a higher chance of bounce-back. Ignoring these levels risks misreading band signals during sideways or volatile phases.
Combining Bollinger Bands with RSI, MACD, volume, and trend analysis offers a more rounded perspective. It streamlines decision-making by eliminating unreliable signals and pinpointing better entry or exit points, crucial for traders looking to navigate India’s varied market conditions effectively.
Mastering Bollinger Band settings requires more than picking numbers; it involves practical steps to ensure your strategies work in real market conditions. Traders often overlook vital testing and pitfalls, so this section highlights how to fine-tune your approach and avoid costly errors.
Indian trading platforms like Zerodha Kite, Upstox Pro, and Sharekhan provide built-in tools to backtest strategies with Bollinger Bands. These platforms let you simulate your chosen settings against past stock data, revealing how your strategy would have performed through various market phases. Testing on well-known Indian stocks like Reliance Industries or Infosys during different periods can show if your settings work well under fluctuating conditions or require adjustment.
Evaluating performance across market phases means checking how Bollinger Bands behave during bull runs, bear markets, and sideways trends. A setting profitable during a trending market may produce false signals during consolidation. For example, during the 2020 market crash, wider bands helped filter noise, whereas tighter bands were better in the steady rally that followed. Backtesting helps reveal these nuances, guiding you to tweak standard deviations or moving average periods for better responsiveness.
Relying solely on default settings like the 20-period moving average with 2 standard deviations can be risky. Markets evolve, and so should your settings. For instance, many Indian intraday traders narrow bands to catch quick price moves, whereas position traders extend periods to filter out noise. Sticking blindly to defaults limits your strategy’s adaptability and may cause missed opportunities or false entries.
Misinterpreting band squeezes and breaks is another frequent error. A band squeeze indicates low volatility but not always an impending big move; it might just be consolidation. Conversely, a price break outside the band is not guaranteed to continue in that direction. For example, on the NSE, a price spike beyond the upper band in Infosys might be a temporary overshoot rather than a breakout. Combining squeezes with volume spikes or RSI readings helps avoid jumping the gun.
Ignoring market context leads to poor decisions with Bollinger Bands. A breakout in a strong uptrend confirms momentum, but the same breakout in a choppy or weak market might fail. For example, during festive seasons when markets can be erratic due to lower volumes, Bollinger Bands signals should be interpreted carefully. Understanding market phases, economic news flow, and sector trends alongside Bollinger Bands improves your trade quality significantly.
Practical use of Bollinger Bands depends on thoughtful adaptation, continuous learning, and integration with market realities rather than static application of popular settings.
By backtesting regularly and avoiding common pitfalls like over-reliance on defaults or ignoring context, you can use Bollinger Bands more effectively to identify solid trade opportunities across Indian equity and commodity markets.
📱 Looking for the best mobile for trading in India? Learn which mobiles offer fast processing, sharp display, strong security & smooth connectivity for traders.

📈 Explore demo trading accounts for Indian traders! Learn, practise strategies, and get platform insights risk-free before investing real ₹₹. Perfect for all levels!

📊 Understand key chart patterns for trading success! Learn how to identify trends, apply strategies, and access handy PDF guides to sharpen your skills.

📈 Learn how to read binary trading candlestick patterns effectively. Understand single and multiple candle signals, avoid common errors & boost your trading accuracy.
Based on 9 reviews